
Course 1 · beginners · no prior knowledge
Statistics, the basics
Short videos in the order that makes them build on one another, and a workbook that makes you use them. It starts at the very beginning: what a dataset is, which kind of data it holds, where the middle of it sits, and how spread out it is. By the end you can read a boxplot, judge an outlier, say why a mean and a median disagree, read a cloud of dots, tell a link from a cause, and spot a chart that misleads.
Start with lesson one See the prices
- 15 lessons, 13 out now
- 215 workbook questions
- 5 levels, remember to evaluate
- Free to watch, no account
How it is built
Three rules the whole course is made to, and you can check every one of them yourself.
One idea per video
Nothing is introduced before it is needed. Each video takes a single concept, builds it from a pile of dots, and stops. Five to seven minutes, no filler.
Every number is checked in code
The figures in the videos and the answers in the workbook come from the same datasets, and a script recomputes every stated number before anything is published. If a number is wrong, the build fails.
You have to use it
Watching is not learning. Every chapter asks you to compute, explain, apply, take apart and judge, which is the five levels the questions are written to.
The 15 lessons · in this order
Not the order they were published in. This is the order in which each one gives you what the next one assumes. 13 are out; the rest are being made, and the workbook chapter for each one lands with its video.
- Types of Datacontinuous, categorical, dichotomousto come
- Describing Categorical Datacounts, proportions and the modeto come
- Histograms: Bin Width Changes the StoryTwenty-eight students, one class, how many minutes each needs to get to school — and the list tells you almost nothing until you cut it into bins and stack what lands in each.6:21
- Mean vs Median: Which One to Use When?The mean is the balance point of your data, the median is the middle person.5:20
- Percentiles & IQR Explained SimplyHow to say how special something is without assuming a bell curve: sort, then count.4:50
- The Boxplot Explained SimplyFive numbers — minimum, Q1, median, Q3, maximum — folded into one small picture.5:01
- Variance: Why We Divide by n − 1Two players, eight turns each, and exactly the same average reaction time: 280 milliseconds.5:43
- The Normal Distribution, Explained SimplyThe most famous shape in statistics, built up from 250 people and a pile of dots.6:07
- Z-Scores Explained Simply: How Rare Is 2 Metres?One ruler for every bell curve.4:53
- Skewed Distributions Explained SimplyThe hill, the tail, and why the name follows the tail.6:22
- The Log Transformation: One Axis TrickThree hundred incomes, one billionaire, and a page that gives up: everyone collapses into a single smear against the wall.6:51
- Scatterplots: Two Variables at OnceTwenty-four students, two numbers each: hours on the phone and hours asleep.6:58
- Correlation: What r Really Tells YouCorrelation is one of the most quoted numbers in statistics, and one of the most misread.6:46
- Correlation vs Causation: Do Big Feet Read Better?At one primary school, children with bigger feet read better: the correlation is plus 0.75.7:02
- Misleading Graphs: Why the Axis MattersOne town, one month of buses.5:26
Every lesson has its own page with chapters and the full transcript, and a six-question quiz on the home page.
The workbook · 15 chapters
A companion to the videos, on paper or on screen: 15 chapters plus an introduction and a mixed exam, around 215 questions across five levels when it is finished, of which 172 are written and checked today. Every written question comes with a model answer and a marking checklist. The same data as the videos, so a figure you saw on screen is the figure you work on. Every figure is in colour, and the printed edition is printed to order.
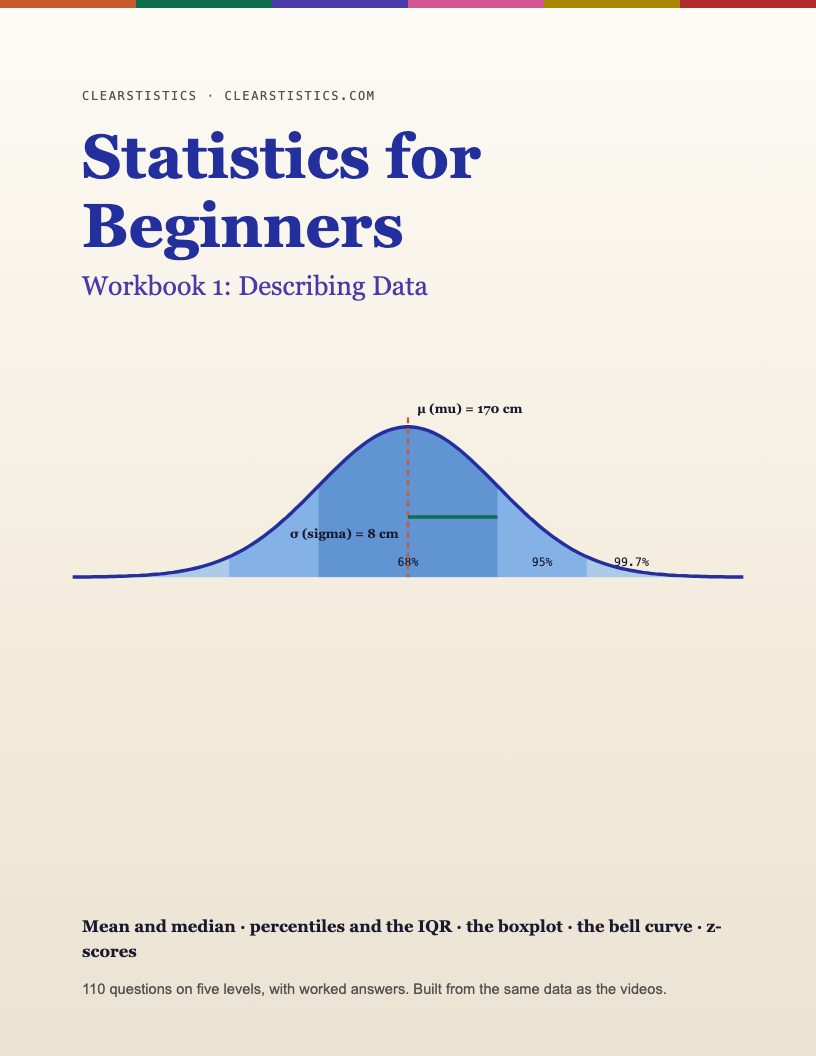
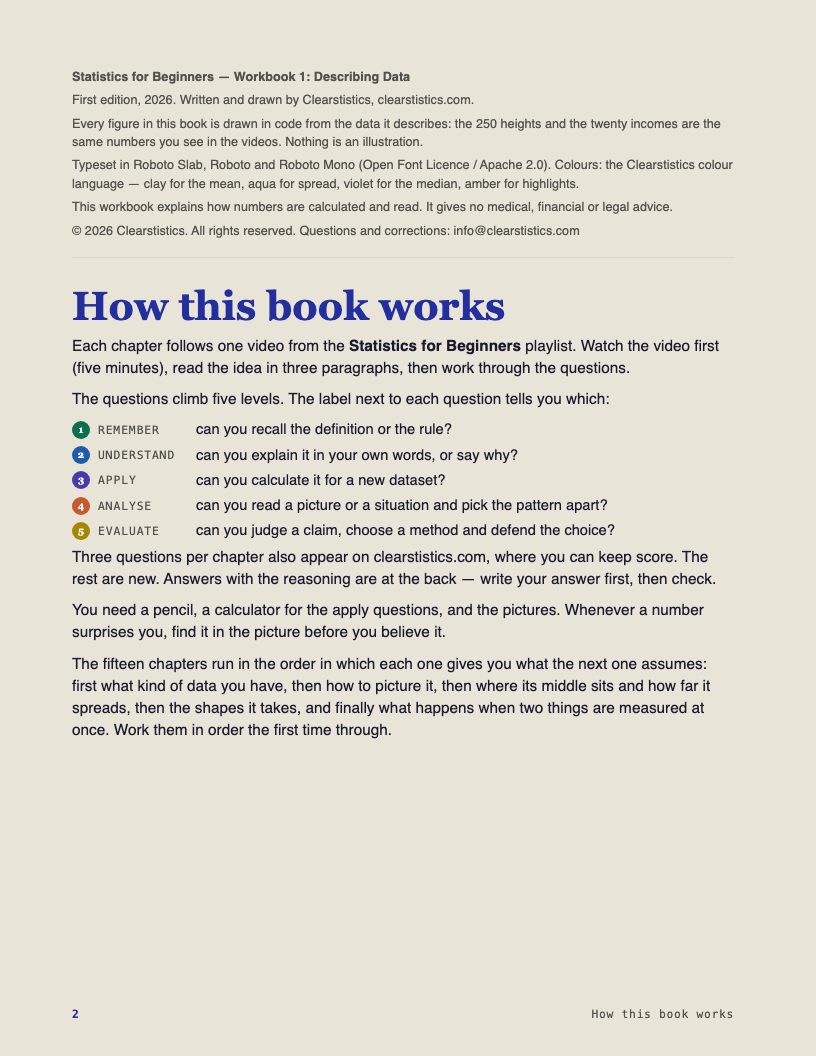
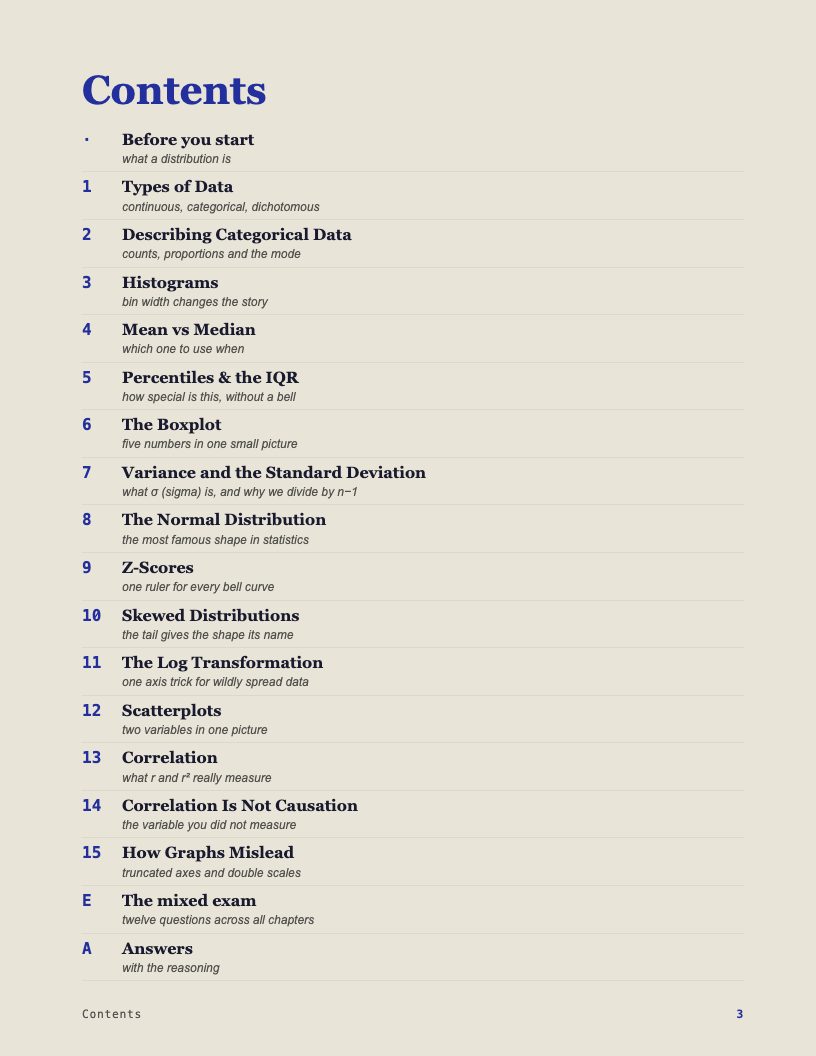
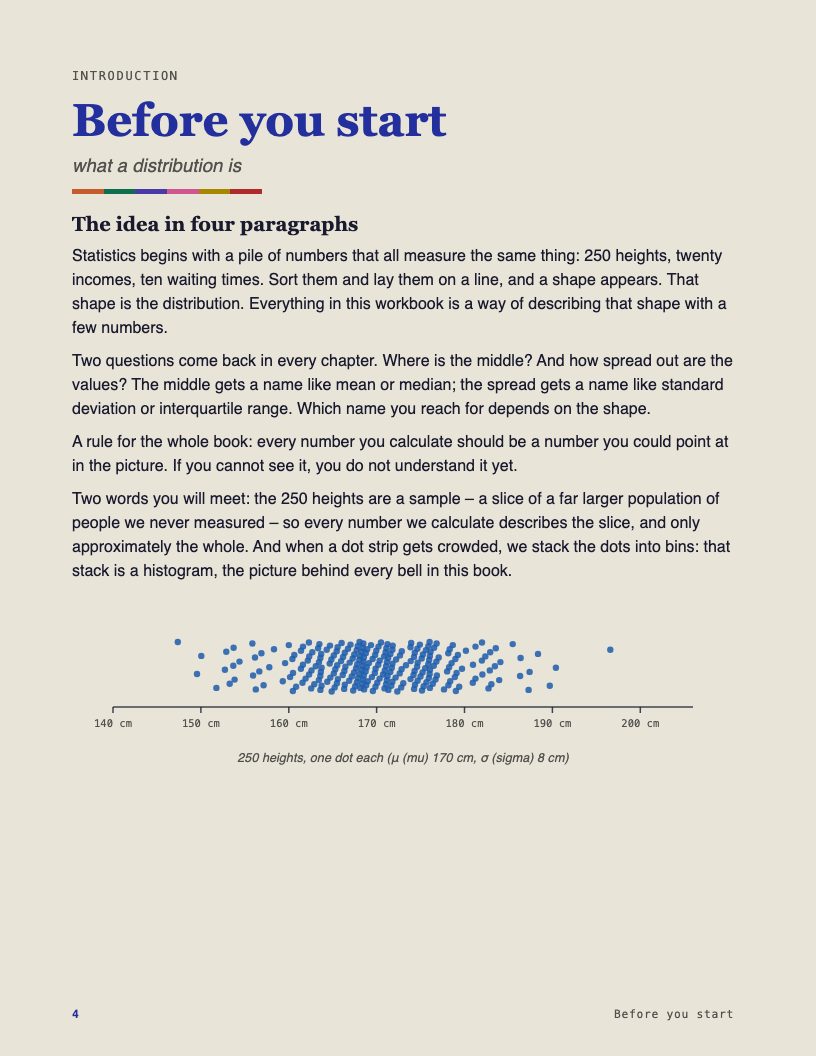
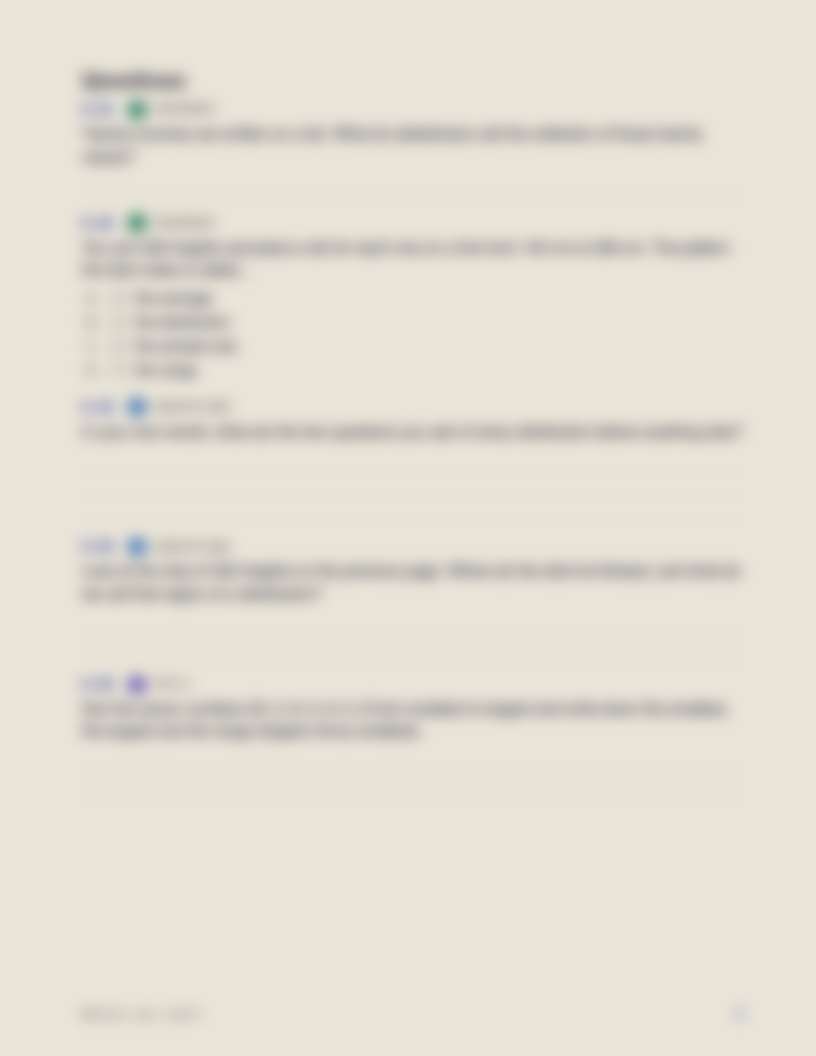

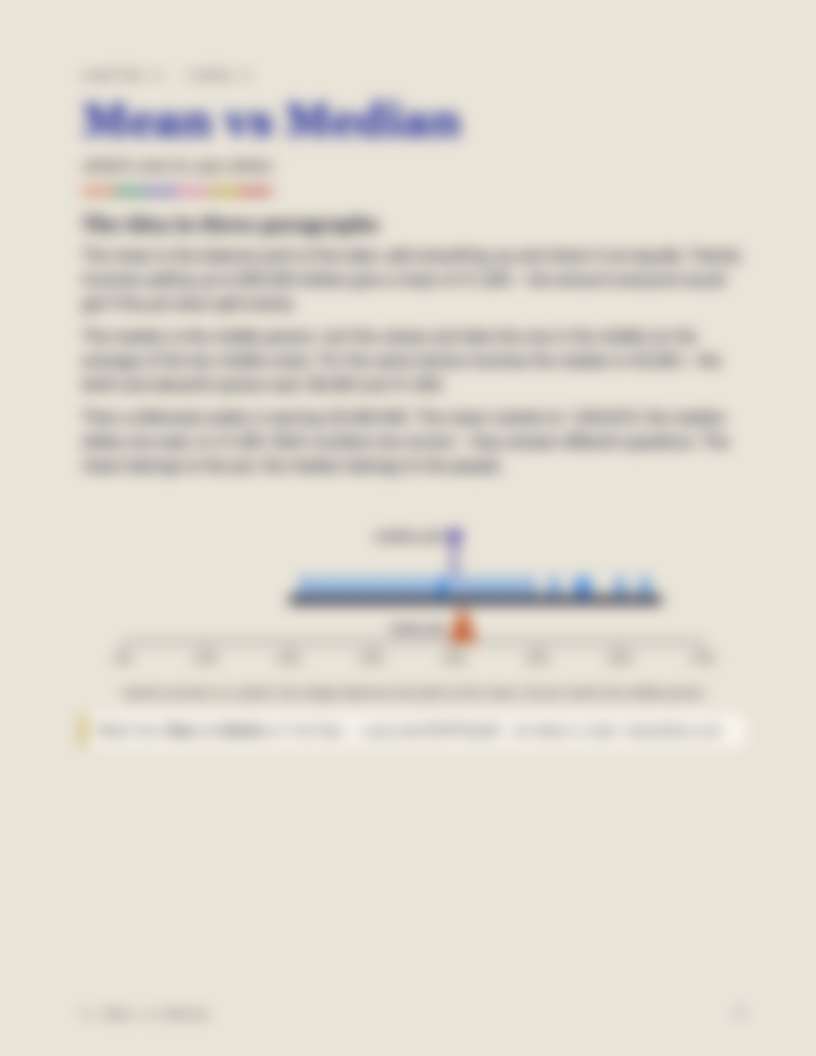
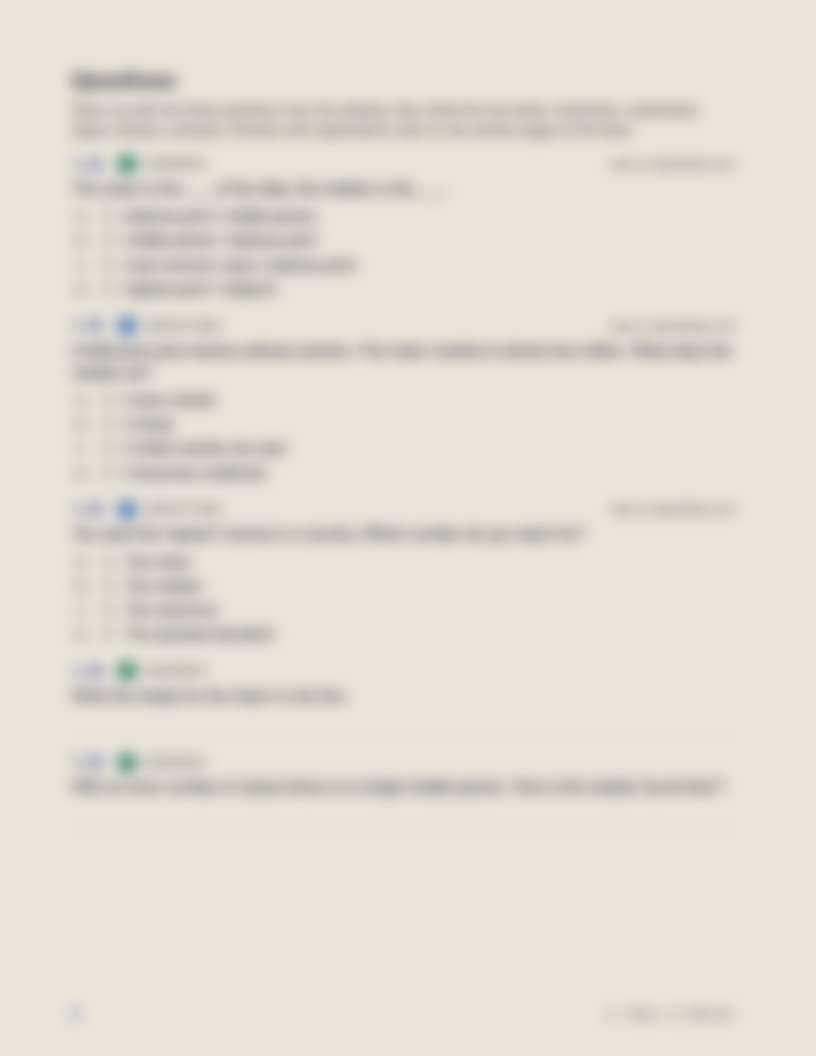
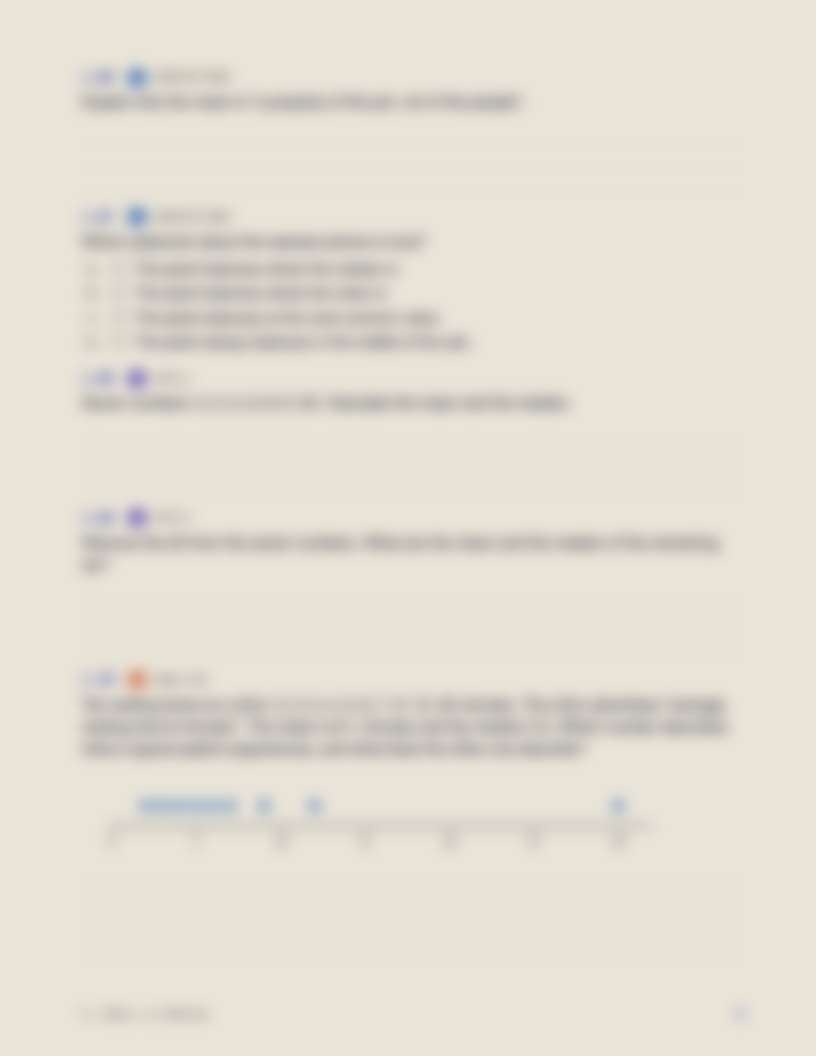
Look inside
The cover, the contents and the first pages are shown here in full. The rest of the book is not on this site.
It comes as a PDF you download, or as a printed copy in colour, made to order and posted to you.
Prices
The videos are free and stay free. The workbook is what is paid for, either on its own or with the online marking around it.
Early bird: 25% off until all 15 chapters are finished. What you buy at the early price you keep at that price for its term: a PDF is yours outright, a year is a year. The struck-through figure is the price afterwards.
The videos
Freealways
- The 13 lessons that are out, in order
- Chapters and full transcripts
- 47 quiz questions on this site
- No account, no sign-up
The workbook
€18 about $21€25 PDF, one-off, incl. VAT
€26 €35 about $30 for a printed copy, in full colour, plus postage
- 15 chapters, an introduction and a mixed exam
- Around 215 questions on five levels
- Model answers with the reasoning
- Printed to order, so it is never out of stock
Checkout not open yet
Online workbook
€54 about $63€72 per year, incl. VAT
- Every course on this site, this one and the ones that follow, for as long as you subscribe
- Real-time marking on every question, multiple choice and written alike
- Multiple choice and calculations scored the moment you answer, with the reasoning
- Written answers: the model answer and a point-by-point checklist straight away
- AI feedback on your own wording, 40 checks a day
- Your progress saved across chapters
Checkout not open yet
For a class
€15 about $17€20 per student, per year, excl. VAT
€150 €200 about $174 for the teacher alone, without student seats, excl. VAT
- An online workbook account for every student, covering every course on this site
- The class view below: progress and score per student
- The full workbook, answer key and quiz variants for the teacher
- Ten students minimum, so €150 is the smallest order
- Invoice on request
Indicative prices for something still being built. Prices for individuals include VAT; prices for schools exclude it, as is usual for an invoice. Everything is charged in euros; the dollar figures are a guide at the rate of early September 2026. Nothing is for sale yet and there is no checkout. Students and teachers who want to try it early shape what goes in: write to info@clearstistics.com.
For teachers · follow your class
One key for the teacher, the whole class underneath it. You see who has watched which video, how far each student has come in the workbook, and what they scored on every quiz. Progress and score are two different things, so you get both.
Teacher key
Your class
You invite your students; each one gets their own account, so their answers and progress stay theirs. You see the whole class in one view.
- Amara92%9/10
- Joris78%6/10
- Lieke64%8/10
- Sam45%5/10
- Noor31%7/10
What comes after this one
This is course 1. Two more are being written, each starting where the one before it stops. The outlines below are the current plan, not a promise, and no dates are set.
Course 2 · in development
Comparing groups
From one distribution to two. Sampling and what a sample can and cannot tell you, the confidence interval, what a p-value actually says, and why effect size is the number that answers the question you asked.
Course 3 · in development
Reading the evidence
How studies are built and how they fail. Study designs, bias and confounding, absolute against relative risk, and how to read a forest plot without taking its word for it.
Want one of these sooner, or a topic that is not listed? Say so at info@clearstistics.com — it decides the order they get made in.